aturgut
Turkey

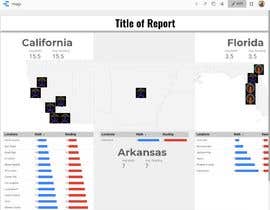
Template for infographic design to show average scores of clients for a location (Math/Reading).
This should be easy to edit in Illustrator or Google Data Studio.
Graphic of the states of California, Arkansas, Florida. Or you may send us a design that would work better to display the data without the maps.
This will mostly be shown online and for PowerPoint slides.
Attached a sample from previous reports. Looking for a professional and clean design.
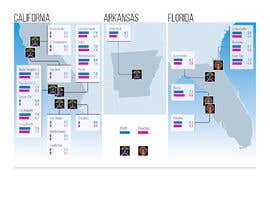
11” wide; 8.5” height
Leave 1” on the top, bottom, or side to add logo, title of report, and key after contest
Orange logo to be placed:
1 logo near Jacksonville, Florida (3 locations named: Lone Star, Biscayne, Jacksonville)
1 logo near New Port Richey, Florida (1 location named: Pasco)
1 logo near St. Petersburg, Florida (1 location named: Pinellas)
Purple logo to be placed:
1 logo near Gainesville, Florida (1 location: Gainesville)
1 logo near Little Rock, Arkansas (1 location: Little Rock)
1 logo near San Diego, California (3 locations: North County, San Diego, South Bay)
1 logo near El Centro, California (1 location: El Centro)
1 logo near Los Angeles, California (5 locations: Boyle Heights, Pico Union, Culver City, Los Angeles, Long Beach)
1 logo near Inland Empire, San Bernardino/Riverside County area (4 locations: Inland Empire, Indio, Moreno Valley, Perris)
1 logo near Sacramento (2 locations: Sacramento, S. Sacramento)
1 logo near San Jose (1 location: San Jose)
“Beautiful design work. Thanks for the revisions.”
![]() oabf, United States.
oabf, United States.

Post Your Contest Quick and easy

Get Tons of Entries From around the world

Award the best entry Download the files - Easy!